
Honestly if you’re a builder, you already know the story. Every early-stage fee in a project has to be justified to finance or a project head, in numbers, not in “best practice.” And “plan the kitchen early” usually gets pitched as exactly that, best practice, which is precisely why it’s such an easy line item to cut the moment budgets tighten.
So let’s try making the case a different way.
Instead of arguing philosophy, let’s put a kitchen planning fee up against five real return streams, in the same language a project head prefers to measure everything else on the project budget.
And let’s be honest right up front, the evidence on some of these streams is genuinely mixed, not neatly in our favour. I’ll show you the range, not just the number that makes the best case, and I’d genuinely encourage you to test this on your own project data rather than take any of it on faith. Here’s what we’ll cover: the five return streams, a simple worksheet to run the numbers yourself, and how to actually present this to finance.
The Investment Side
Think of a kitchen planning fee as a pre-design line item, something finance already has a budget category for, just like they already budget contingency. And here’s a useful way to frame that comparison: contingency is basically what you spend when planning fails. A planning fee is what you spend so you need less of it.
Most project heads already accept that structural and MEP planning fees are non-negotiable in every case, nobody questions paying an engineer to calculate loads before pouring a slab. But on the other hand, Back of House Planning tends to get treated differently, almost as an optional after thought rather than the same category of upfront risk protection or non-negotiable like structural or MEP planning. That’s really the framing mismatch this whole piece is trying to fix.
I won’t quote a specific fee percentage here, since pricing genuinely depends on project complexity and footprint, and quoting a number without that context would be misleading. Use your own proposal figure when you run this worksheet, and treat it the same way you’d treat any other design-stage fee already in your budget.
Return Stream 1: Avoided Rework and Change Orders
Here’s where the data gets interesting, and where I want to be upfront about how mixed it actually is. The Construction Industry Institute’s widely cited dataset puts direct field rework at about 5% of total project cost on average, climbing to 12.4% at the 90th percentile, the worst-performing projects in their sample. A separate CII quality-deviation study found that design changes, errors, and omissions caused roughly 79% of deviation costs, though that particular study covered industrial projects and didn’t factor in schedule impact, worth flagging clearly. Another CII analysis, this one covering 359 projects, found that design errors and owner-driven changes raised costs more than any other source.
But here’s the honest counter-evidence. One contractor’s actual internal records, reported through ASCE, found rework averaging just 0.38% of contract value before project completion, or 0.76% once post-completion fixes were included. Meanwhile, UK estimates that include indirect costs run as high as 10-25%. That’s a huge range, from under half a percent to a quarter of the project. What that tells you is simple: don’t just blindly trust an industry average for your own project. Pull your own change-order log.
Why is the range this wide? Mostly because “rework” gets defined differently across studies, some count only direct field labor, others fold in design rework, indirect costs, and latent defects discovered years later. Also partly because project type matters enormously, an industrial plant behaves nothing like a hospitality fit-out.
So to make your log useful, tag every kitchen-driven item specifically: utilities, hoods and ducts, drains, structural changes tied to the kitchen. Once you’ve tagged a couple of past projects this way, you’ll have a real number instead of a borrowed one.
Return Stream 2: Schedule and Carrying Cost
This one’s straightforward to calculate once you have the inputs: days saved, multiplied by your daily carrying cost, interest, site overheads, deferred revenue, or tenant rent-free extensions you’ve had to grant because of a delay.
If your project is RERA-registered and units are already sold, a delay doesn’t just cost you time, it triggers statutory interest owed to buyers. Most states prescribe this at SBI’s highest MCLR plus 2%, which works out to roughly 10.8% a year in most jurisdictions right now. That’s not a rounding error on a delayed handover, that’s a real, compounding cost tied directly to schedule.
For assets you’re holding to lease rather than sell, the cost shows up differently, as lost or deferred rent instead of statutory interest. And there’s a schedule-protection angle worth mentioning here too: fewer late fire and health department rejections, which we’ve covered in more depth in our compliance checklist post, also protect your schedule directly.
Return Stream 3: Procurement
A brand-agnostic equipment spec, the kind that comes out of proper kitchen planning rather than a vendor’s own catalogue, lets multiple vendors bid against the exact same scope. We’ve written about this distinction in more depth in our consultant-versus-vendor piece.
To measure this one on your own project, compare a vendor-led quote against a tendered price for genuinely comparable scope. I won’t hand you an invented percentage here, since the actual savings depend heavily on your market and vendor relationships, but the comparison itself is easy to run once you have both numbers in hand.
Return Stream 4: Area Yield and Revenue Capacity
Something interesting happens when you design the right sized back-of-house facility back of house facility, It avoids two opposite failure modes.
Over-allocate space to the kitchen and you’ve lost the leasable area you could have sold or rented.Under-build it and you’ve sabotaged what tenants can actually produce, which caps their sales, which caps your own percentage rent if that’s part of your lease structure.
This is exactly the balance a good Back of House Consultant is trained to strike, since getting it wrong in either direction costs you money, just in different places on the balance sheet.
We’ve covered this trade-off in more depth in our mall food court piece, and it’s worth repeating the core point here: this decision genuinely needs an operations study before gross floor area gets locked in, not after.
Return Stream 5: Fewer Post-Handover Defects and Disputes
This one’s harder to attach a generic number to, since it’s really about your own operating history.
Defect-liability callbacks, disputes with operators over what was promised versus what got built, delayed openings traced back to kitchen scope specifically, all of it should come out of your own snagging history from past projects, not an industry benchmark.
A Simple ROI Worksheet
Here’s how to put all five streams together. Net return equals the sum of the five streams, minus the planning fee, expressed as both a multiple and a payback period.Here’s the best way to use this table: run the low case for rework first, at roughly 0.4%. If the planning fee still pays for itself even at that conservative number, your case is genuinely robust.
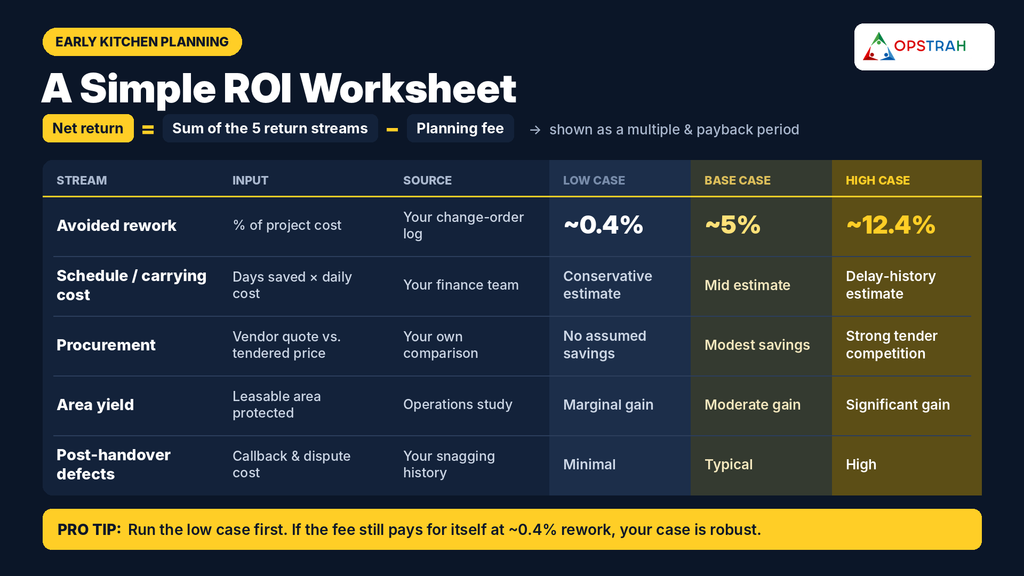
If it doesn’t clear the fee at the low case, say so plainly rather than quietly switching to a rosier number. That kind of honesty is exactly what makes this pitch credible to a skeptical project head.
Testing It on Your Own Projects
Before you present anything to the finance team, do this first. Pull the change-order logs from your last two or three projects. Tag every item that traces back to the kitchen or F&B scope specifically. Cost out both the days lost and the rupees spent. Then compare that total against what a proper kitchen planning proposal would have cost on those same projects. This is really the whole exercise in miniature, and it’s the step that turns this from a theoretical pitch into your own evidence.
Presenting the Case to Finance and Project Heads
Frame the whole thing as risk reduction and contingency protection, not as an added cost. And tie it specifically to gate decisions, the difference between spending on planning at the pre-design stage versus discovering the same gap once construction documents are already issued. That framing matters, because it’s the same language finance already uses to think about every other risk category on a project.
It also helps to be specific about timing when you present this. A project head is far more likely to approve a planning fee framed as “spend this now, before the gate closes on design changes” than one framed as “spend more on the kitchen.” The first sounds more of a familiar risk-management ask. The second sounds like scope creep, even when it’s the exact same money solving the exact same problem.
Where OPSTRAH Fits
Truthfully this is exactly the five-step blueprint we run on every project, with stage-gate checkpoints built in at each phase rather than one review at the end.
Good BOH Design doesn’t happen in a single meeting, it gets checked and rechecked as the project moves forward. I’ll keep this part brief, since the worksheet above is the real value here, not a sales pitch. If you want to see how this played out on a real project, ask us, we can walk through verified figures rather than an illustrative example dressed up as a case study.
The Real Question
The question was never really whether your project can afford early kitchen planning.
It’s which of these five return streams you’re actually willing to bet against.
Rework almost never hits zero. Schedule delays carry a real, calculable cost. Procurement without competition rarely gets you the best price. Area misallocation caps revenue either way it goes wrong. And defects don’t disappear just because nobody planned for them.
If you want to run these numbers on your own project, we’re happy to share the worksheet, or take a short look at your kitchen scope at concept stage before anything’s locked in.